Introduction
Accurate modeling of fans and blowers is fundamental to successful HVAC, ventilation, and industrial air system design. This comprehensive guide explains how to effectively use manufacturer-supplied performance data in FluidFlow to create precise digital representations of real-world fan and blower equipment.
Unlike pumps in liquid systems, fan and blower performance is highly dependent on the density of the gas being moved. FluidFlow uniquely addresses this by automatically correcting manufacturer performance curves—typically provided at standard conditions—to actual operating conditions in your system. By mastering this process, you'll ensure your simulations accurately predict system behavior, optimize equipment selection, and identify potential operational issues before they occur in the field.
Understanding Fan/Blower Performance Data and Reference Conditions
Critical Importance of Reference Conditions
When working with fan and blower performance data, understanding reference conditions is crucial for accurate modeling. Most vendor data is presented at standard reference conditions:
- STP (Standard Temperature and Pressure): 101,325 Pa at 15°C
- NTP (Normal Temperature and Pressure): 101,325 Pa at 0°C
FluidFlow automatically corrects fan/blower performance based on actual flowing air density and pressure conditions. This means that once you've properly defined the reference conditions in your database entry, the software will adjust performance for any operating scenario in your system.
Performance Correction Example
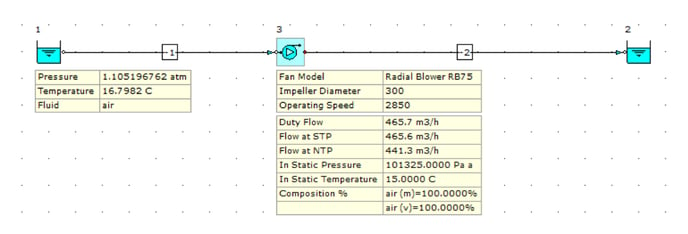
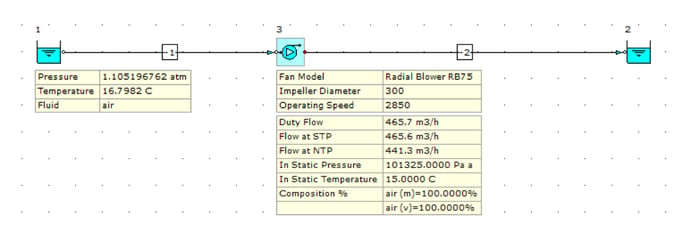
Consider a simple model using air as the fluid with the Radial Blower RB75 as shown below. Using the Back Calc Input Tool, we modified the pressure and temperature conditions at the system inlet (node 1) to achieve nearly exact STP conditions (101,325 Pa at 15°C) at the blower inlet.

The calculated actual duty flow rate is 465.7 m³/h. Examining the data entry for this fan (Radial Blower RB75), we can confirm the curve was defined at STP conditions—nearly identical to our actual operating scenario. The duty flow calculated at STP conditions is 465.6 m³/h. These duty flows are almost equal; the minor difference can be attributed to the slight variation between our system pressure and the precise STP conditions of 101,325 Pa at 15°C.
Adding a Manufacturer Fan/Blower to the Database
Step 1: Access the Boosters Database
- Navigate to Database → Boosters in the main menu
- Select Fan or Compressor
- Click the Add button to create a new equipment entry
- Provide a unique name (e.g., "Vendor A - Model RB75 - 1450 rpm")
Step 2: Enter General Equipment Specifications
Input the following specifications from the manufacturer's datasheet:
- Data Operating Speed: Enter the equipment's operating speed (e.g., 1450 RPM)
- For variable speed equipment, specify both minimum and maximum speed values
- Impeller Diameter: Enter the fan's impeller diameter; specify minimum and maximum values if applicable
- Optional manufacturer, materials, and application details for database organization
Step 3: Define Reference Conditions (Most Critical Step)
This is the most critical step for accurate performance modeling:
- In the Volume Flow Condition field, select the appropriate reference condition
- Choose Standard (1 atm; 15°C) if manufacturer data is referenced to STP
- Choose Normal (1 atm; 0°C) if manufacturer data is referenced to NTP
- Verify that selected conditions match exactly what's specified in vendor documentation

Step 4: Define the Performance Curve (Pressure Rise vs. Flow)
This curve defines the pressure rise the fan/blower can generate at various flow rates:
- Click the three-dot button in the Capacity Curve Data field
- Select appropriate units for flow (e.g., m³/h) and pressure rise (e.g., Pa)
- Enter data points from the manufacturer's curve, starting from zero flow condition (shut-off pressure)
- Include multiple intermediate points across the intended operating range
- Specify minimum and maximum flow limits
- Select equation order or choose BestFit for automatic optimization
- Verify that the generated curve accurately represents the manufacturer's data
Step 5: Define Additional Performance Curves
For complete analysis, add efficiency curve if available.
Efficiency Curve:
- Click the three-dot button in the Efficiency Curve Data field
- Enter efficiency vs. flow data points from manufacturer curves
- Select equation order or choose BestFit for automatic curve fitting
- Verify curve accuracy
Modeling and Analyzing Fan/Blower Performance in Systems
Step 1: Build the System and Insert Equipment
- Construct your network on the flowsheet by adding the appropriate pipes and nodes.
- From the Component Palette under the Boosters tab, drag and drop a Fan or Compressor node

Step 2: Assign the Manufacturer Equipment
- Select the fan/blower node on the flowsheet
- In the Input Editor, turn off Automatically Size if enabled
- Click the three-dot button beside the Fan Model field
- Find and select the manufacturer equipment you added to the database
Step 3: Calculate and Analyze Results
When you run the calculation, FluidFlow automatically corrects the fan/blower performance from reference conditions to actual gas density:
- Click the Calculate button
- Review the Messages tab in the Data Palette for warnings or errors
- Select the fan/blower to examine the calculated performance:
- Duty Flow: Volumetric or mass flow at actual operating conditions
- Flow at STP: Volumetric or mass flow equivalent at standard conditions
- Flow at NTP: Volumetric or mass flow equivalent at normal conditions
- Duty Pressure Rise: Actual pressure increase across the fan
- Duty Efficiency and Duty Power (if curve data was entered)
Step 4: Visualize Performance Using Charts
-
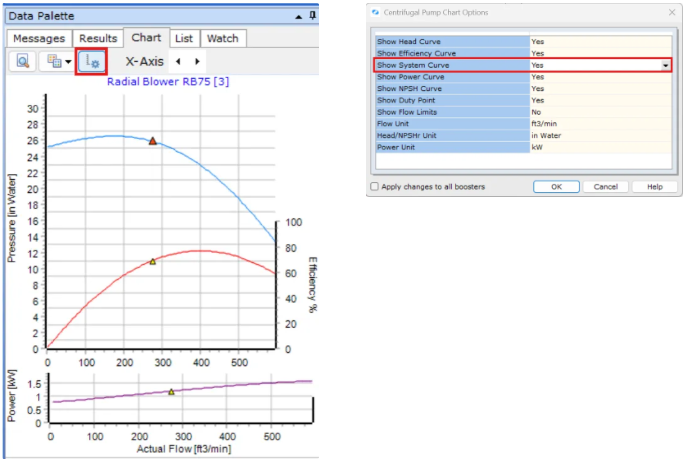
With the equipment selected, navigate to the Chart tab of the Data Palette
-
The chart displays performance curves with the calculated Duty Point marked
-
Enable Show System Curve by clicking the Settings button to see the interaction between equipment and system resistance

-
Verify that the operating point falls within manufacturer's recommended range
Best Practices for Fan/Blower Modeling
Data Entry and Reference Conditions
- Always double-check vendor datasheet and ensure Volume Flow Conditions in FluidFlow match exactly
- Include at least 5-7 points distributed evenly across the operating range to ensure accurate interpolation and smooth curve fitting
- Always check that fitted curves match manufacturer data visually
- Keep records of data sources and assumptions made during entry
System Design Considerations
- Ensure fans/blowers operate within manufacturer-recommended ranges
- Match equipment selection to system requirements using system curve analysis
- Select operating points that maximize equipment efficiency
Common Pitfalls to Avoid
- Using incorrect reference conditions (STP vs NTP)
- Mixing static pressure data with total efficiency (or vice versa)
- Using incomplete performance curves that don't cover the full operating range
- Ignoring manufacturer operating limits and recommendations
- Entering too few data points, causing poor curve interpolation
FAQs
Q: What's the difference between STP and NTP reference conditions?
A: STP in FluidFlow is 101,325 Pa and 15°C; NTP is 101,325 Pa and 0°C. Choose the one that matches the vendor data sheet so density corrections are applied correctly.
Q: Can I model variable speed fans and blowers?
A: Yes, enter minimum and maximum operating speeds in the database. FluidFlow can model performance at different speeds using affinity laws, or you can create separate entries for specific operating speeds.
Q: How do I know if FluidFlow's performance corrections are working properly?
A: Create a test model with conditions very close to your reference conditions. The calculated performance should closely match the manufacturer's curve data.
Q: What if I only have limited performance data from the manufacturer?
A: You can model equipment with just the pressure-flow curve as a minimum requirement. However, efficiency and power calculations will be limited without additional curve data.
Conclusion
Accurate fan and blower modeling using manufacturer data is crucial for reliable FluidFlow simulations. By properly defining reference conditions and incorporating complete performance curves, you ensure that your models accurately predict equipment behavior under actual operating conditions.
FluidFlow's automatic performance corrections eliminate the need for manual calculations while providing confidence that your simulations reflect real-world performance. This approach enables optimal equipment selection, efficient system design, and early identification of potential operational issues.
Proper fan and blower modeling in FluidFlow, combined with accurate reference conditions and complete performance data, ensures your gas system designs are efficient, reliable, and automatically account for varying operating conditions—preventing costly design errors.