Master the use of Energy & Hydraulic Grade Lines in FluidFlow to identify trouble spots, optimize pump placement, and enhance system performance and efficiency.
Introduction
Energy and Hydraulic Grade Lines (EGL and HGL) in FluidFlow provide powerful visual diagnostic tools for hydraulic analysis, allowing engineers to quickly identify potential trouble spots in piping systems. These plots serve as essential companions to numerical data, enabling informed design and troubleshooting decisions.
EGL and HGL plots transform complex pressure and energy data into intuitive visual representations, helping you identify system bottlenecks, optimize component placement, and prevent operational issues before they occur.
Key Benefits
- Quickly identify areas of potential cavitation or vapor formation
- Detect high head loss regions that may require design modifications
- Optimize pump placement for maximum system efficiency
- Visualize energy transformations throughout your system
- Improve system reliability and reduce operational energy costs
Understanding Energy & Hydraulic Grade Lines
Energy Grade Line (EGL)
The Energy Grade Line represents the total energy in the system at any point, calculated as:
- EGL = Static Pressure + Elevation + Velocity Pressure
- EGL = Piezometric Pressure + Velocity Pressure
This line shows the sum of all forms of energy (pressure, potential, and kinetic) available in the fluid.
Hydraulic Grade Line (HGL)
The Hydraulic Grade Line shows pressure and elevation energy only, excluding kinetic energy:
- HGL = Static Pressure + Elevation
- HGL = Piezometric Pressure
The HGL represents the height to which fluid would rise in a series of piezometer tubes installed along the pipeline.
The vertical distance between EGL and HGL represents the velocity head (kinetic energy) at that point in the system.
Creating EGL & HGL Plots in FluidFlow
-
Access the tool
- Go to Tools | Composite Chart…
-
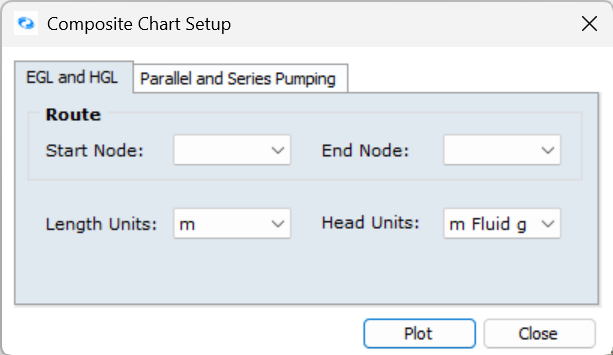
In the Composite Chart Setup dialog, open the EGL and HGL tab

Figure 1. Composite Chart Setup Dialog.
-
Select the desired flow path by specifying:
- Start Node - The beginning point of your analysis
- End Node - The termination point of your analysis
-
Set appropriate length and head units for your display
-
Click PLOT to generate the chart
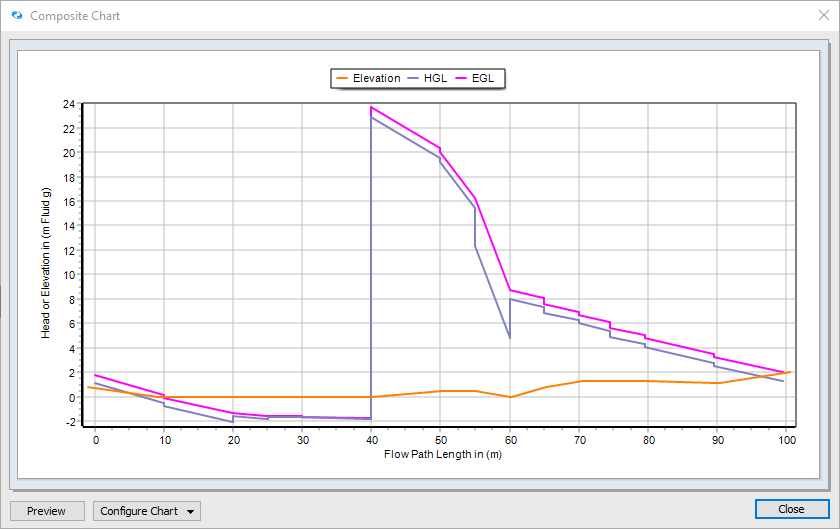
The software generates a composite chart showing EGL, HGL, and elevation profiles along your selected path.
Working with the Plots
- In newer FluidFlow versions, plots update automatically after recalculation
- In older versions, manually reinitialize plots by reselecting start and end nodes
- You can enable component mapping to show node and pipe numbers for easy correlation
Understanding Plot Components
A typical FluidFlow EGL/HGL plot contains three primary elements:
- EGL (top line) – Represents total system energy (pressure + elevation + velocity)
- HGL (middle line) – Shows pressure + elevation energy
- Elevation (bottom line) – Displays the physical elevation profile of your system
Additional features in the plot include:
-
Vertical jumps in EGL/HGL indicate pumps (upward) or control valves (downward)
-
Steep slopes in the EGL represent areas of high friction loss
-
Converging EGL and HGL indicates low velocity areas
-
HGL below elevation signals negative pressure zones (potential problem areas)

Figure 2. Sample EGL & HGL Plot.
Practical Example and Calculations
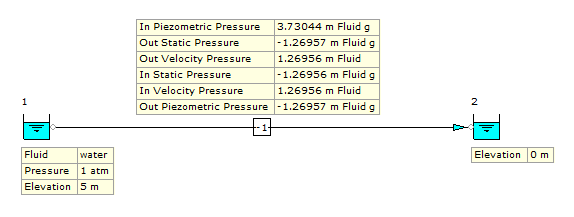
Let's examine a simple piping system example with calculations to illustrate how EGL and HGL values are determined:

Figure 3. Sample Piping System.
EGL Calculation
Inlet: (-1.2696 + 5 + 1.2696) = 5.0 m fluid
Outlet: (-1.2696 + 0 + 1.2696) = 0 m fluid
Piezometric Pressure:
Inlet: (3.7304 + 1.2696) = 5.0 m fluid
Outlet: (-1.2696 + 1.2696) = 0 m fluid
HGL Calculation
Inlet: (-1.2696 + 5) = 3.7304 m fluid
Outlet: (-1.2696 + 0) = -1.2696 m fluid
Piezometric Pressure:
Inlet: 3.7304 m fluid
Outlet: -1.2696 m fluid
Common Use Cases
| Scenario | EGL/HGL Application | Benefit |
|---|---|---|
| Long-distance fluid transport | Identify pressure management issues | Prevent pipeline damage and fluid settling |
| Multi-pump configurations | Optimize pump placement | Maximize efficiency and prevent cavitation |
| Water distribution networks | Ensure adequate pressure at service points | Maintain reliable service delivery |
| Systems with elevation changes | Analyze gravity effects on flow behavior | Design efficient routes with minimal pumping |
Best Practices for Using EGL & HGL Plots
- Cross-check with measurements: Always verify plot results with actual field measurements when possible to ensure model accuracy
- Monitor critical areas: Pay special attention to locations where HGL approaches or dips below the elevation line, indicating potential cavitation or negative pressure zones
- Use during all project phases: Leverage plots during both design and operational troubleshooting
- Review after changes: For multi-pump systems, ensure plots are reviewed after any configuration or control setting changes
- Consider flow variations: Generate plots for different flow scenarios (minimum, normal, maximum) to ensure system reliability
Interpreting Common Patterns
Learn to recognize these common patterns in EGL/HGL plots:
- Parallel EGL and HGL: Indicates constant velocity throughout the section
- Converging EGL and HGL: Shows decreasing velocity (expanding pipe or reduced flow)
- Diverging EGL and HGL: Reveals increasing velocity (contracting pipe or increased flow)
- Steep EGL drop: Signifies high friction loss (potential restriction or undersized pipe)
- HGL below elevation: Warns of negative pressure (potential cavitation risk)
- Sudden EGL rise: Indicates pump or energy addition point
- Sharp EGL drop: Shows control valve, orifice, or other restriction
FAQs
Q: What's the most important difference between EGL and HGL?
A: The EGL includes velocity head (kinetic energy), while the HGL does not—it only accounts for pressure and elevation (potential energy).
Q: Can I plot these lines for a section of the system only?
A: Yes, you can select specific start and end nodes to focus on particular sections or problem areas of interest.
Q: Will EGL/HGL plots help me prevent cavitation?
A: Yes, identifying low-pressure regions where the HGL approaches or drops below the elevation line allows you to make adjustments before cavitation occurs.
Q: How do pumps and valves appear on HGL/EGL plots?
A: Pumps create upward steps in both lines (showing added energy), while control valves and restrictions create downward steps (showing energy dissipation).
Q: Can I use HGL/EGL plots for complex systems with multiple branches?
A: Yes, but you'll need to create separate plots for each flow path of interest by selecting appropriate start and end nodes.
Q: How often should I update my EGL/HGL analysis?
A: Update your analysis whenever you make significant changes to your system configuration, when troubleshooting performance issues, or when evaluating system modifications.
Conclusion
Energy and Hydraulic Grade Line plotting in FluidFlow provides engineers with a powerful visual tool for system analysis, enabling a better understanding of pressure distribution and energy transformation throughout piping networks. By mastering EGL and HGL interpretation, engineers can identify potential trouble spots before they become problems, optimize system configurations for improved performance, and ensure reliable operation across varying conditions.
Mastering EGL and HGL analysis empowers engineers to design more reliable, energy-efficient fluid systems while preventing costly failures through early detection of hydraulic trouble spots—ultimately saving time, reducing operational costs, and extending equipment life.